Tracker Runner: a control plane for Tracker pipelines
← All WritingUntil recently, we ran our own multi-agent pipelines in a terminal, on somebody’s laptop, probably with the lid propped open.
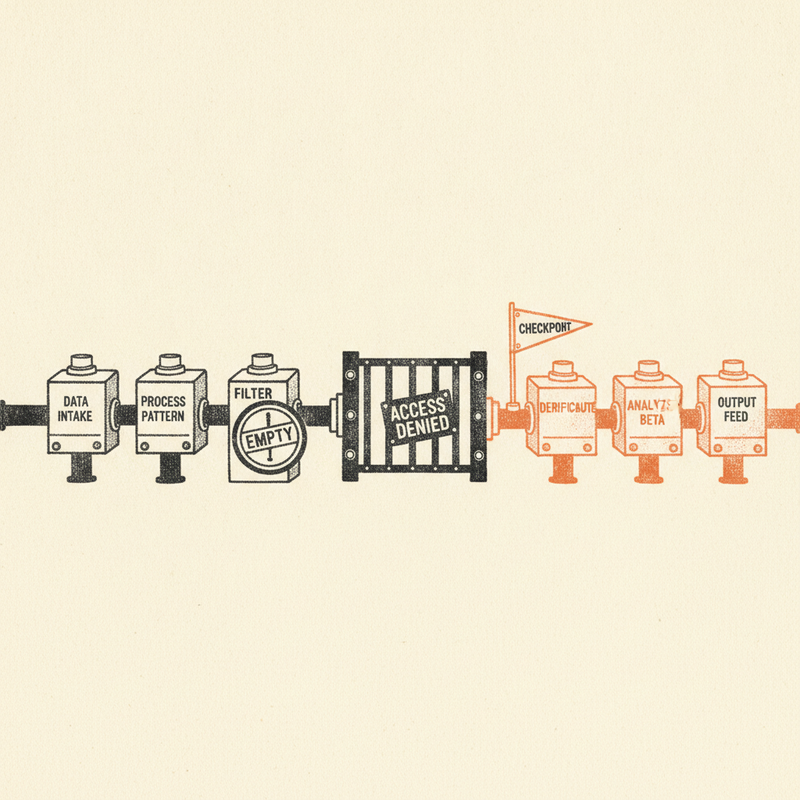
Tracker is good at executing a pipeline. But a pipeline run is a long-lived thing. It’s an hour of agents building, testing, and stopping now and then to ask a human a question, and a terminal session on a laptop is a poor home for something that runs that long. Close the lid and the run pauses. Step away and a checkpoint sits unanswered for forty minutes. Ask what your runs cost this week and you’re grepping logs across machines.
Tracker Runner fixes that. It’s a service that wraps Tracker’s engine and gives every run a permanent address. You start a run from wherever is convenient: an HTTP call, a web form, Slack, a GitHub webhook, or an MCP client. Because that address is permanent, any surface you’ve set up can reach the same run. Watch it work in real time, answer its questions, steer it while it runs, and see it on one screen with every other run and what each one costs.
It’s early: the service is alpha, we run it ourselves rather than sell it, and it’s still approaching the shape we want. But it works end to end, and that shape is close.
Answering a run’s questions, wherever you are
Tracker pipelines stop to ask people things on purpose. Approve this plan before the build starts. Pick between two implementations the agents wrote in parallel. Decide whether a flaky test should block a milestone or wave it through. These checkpoints are where a person’s judgment enters an otherwise autonomous run.
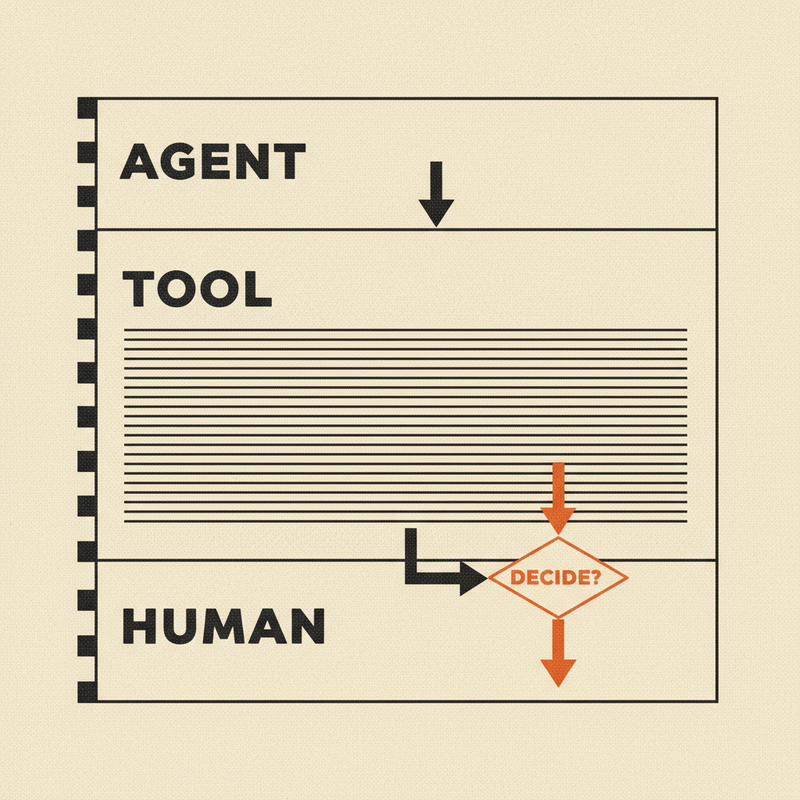
In a terminal, a checkpoint is a prompt that waits for whoever happens to have that terminal open. Tracker Runner turns it into a question with an address. It shows up in a queue in the browser with everything you need to answer it: which run, which step, what the pipeline is asking, and the choices in front of you. It also shows up in Slack, in a thread, where the people who should weigh in get notified and can answer without leaving the conversation. Because a checkpoint is just a question waiting for an answer, the channel it arrives on doesn’t much matter. Pointing it at a new one, whether that’s Discord, a text message, or wherever your team already works, is a matter of teaching that channel to ask and listen. Today that’s the browser and Slack.
A checkpoint reaches the people set up to handle that run, whoever on your team or in your org that is. Access is checked at every step: a login, a request check that blocks forged submissions, and a role. The roles run viewer, member, approver, owner, and only approvers and owners can resolve a checkpoint. A run belongs to one account, and only that account can answer its questions. So reaching a checkpoint from your phone never means anyone with the link can approve a production change.
You can also steer a run mid-flight. Reply in its Slack thread and your message goes to the agent that’s running right then, so you can nudge it, correct it, or hand it context without stopping it.
Underneath, every event a checkpoint produces is stamped with its run, its step, its session, and its own id, and the opening event records what kind of question it is. That’s enough for the service to always tie a question to the answer that resolves it. Those events are written to durable storage the moment they happen, each with a running sequence number, and the live view replays anything a browser missed when it reconnects. Lose your signal in line for coffee and the question is still waiting when you get back.
Every run in one place
The old way to see what your runs were doing was to keep the right terminal open, or to go digging in log files afterward. Tracker Runner puts every run on one screen. We collect all the events, outputs, and general telemetry from every run in our database so you can watch the run from anywhere, or grep through it later to find out exactly what it did or did not do.
The control room lists them all at once: what stage each one is in, which need a person, which are sitting at a checkpoint, which are still going, and which have finished. Running and finished runs sit side by side, so “what happened last night” and “what’s happening now” are the same view. Status shows up in plain language, too. A viewer sees “waiting for a person,” not an internal state name.
Each run carries its cost. The list shows a dollar figure per run, and a stats page breaks spend down by model, by person, by tool, and by team and by month. The same numbers come back over the API, so you can pull them into whatever you already use for reporting. When you want to know what a week cost, the figure is on the page instead of scattered across machines.
Every run also keeps a full history you can hold onto. The record is append-only and tamper-evident: each entry is chained to the one before it, so a later edit or deletion shows, and the trail is kept apart from the run itself so it survives even after the run is gone. When a run finishes, its logs and its event stream are packed into one archive you can download through a signed link. Nothing about a run is locked inside a format only we can read.
What happens when a run breaks
Long runs get interrupted. A machine reboots, a worker is redeployed, a process is killed. Tracker Runner treats that as routine rather than fatal. An interrupted run goes back in the queue on its own and is picked up again against the same working directory, up to a set number of attempts, with nothing to click and nothing to restart by hand.
Some failures are cheaper to catch before they start. A pipeline that won’t validate is turned away the moment it’s submitted, before it spends a cent, rather than an hour in when an agent finally trips over the problem. Runs also carry ceilings, on tokens, on dollars, and on how long they run, inherited from the engine, and a run that hits one stops and says so instead of quietly running up a bill.
Getting work in
There are five ways to start a run, and they exist because work arrives from different places.
An HTTP call is the plain one: post a pipeline to the API and get back a run you can watch. The web form is the same thing with a page around it, for when you’d rather click than curl. Slack starts a run from a message, so a pipeline can kick off where your team already talks. A GitHub webhook starts one from an event in a repository, so a push or a comment can set a run going without anyone touching a terminal. And an MCP client lets another agent or tool start and cancel runs directly, so Tracker Runner can sit inside a larger automated system.
All of it runs behind one auth model. A caller carries a signed token that says which org, team, user, and role it is, minted by the service, and that token decides what it’s allowed to do. The same model separates accounts three ways: a solo setup for one person, a team setup that keeps everything strictly walled off, and an org setup for running many teams under one roof. A caller with only a bearer token gets the access level that fits, and nothing crosses an account boundary that shouldn’t.
Each run in its own box
A run does real work. It clones repositories, writes files, runs shell commands, and builds and tests code. You don’t want that landing on the machine that coordinates everything, or bleeding into another run happening right next to it. So Tracker Runner executes each run inside its own locked-down Docker container: a clean, disposable workspace, isolated from the host and from the other runs around it. When the run finishes, the container goes away.
Today those containers run on the service’s own machine. You can also configure it to run your workers on Fly.io sprites. We’re also looking at Daytona, E2B, and similar providers. Because the control plane already treats a run as something with an address rather than a process on a particular laptop, moving where the work executes won’t change how you submit it, watch it, or answer its questions.
One engine, many front ends
Tracker Runner isn’t a fork of Tracker with a web server stapled on. It uses Tracker the way any other program would: as a library, pinned to a released version, driven through the interface Tracker publishes for building on it. One part of that interface hands the engine a way to ask people questions. Another streams every event the engine emits. The Runner is a consumer of the same public interface Tracker exposes for its own front ends, its Slack bot and its terminal REPL.
When we needed the engine to expose something it didn’t yet, we added it to Tracker in the open, and every tool built on that interface got the same improvement. We even replay Tracker’s own recorded runs against each new version, so an upgrade can’t quietly change how the engine behaves under us.
Keeping that boundary means the engine stays a sharp, auditable, single-purpose tool while the control plane grows the things a control plane should own: who can do what, what’s happening across every run, and what it all costs. The service ships as one binary that can run as a single process or split into an API, a worker, and a runner, and it stands up with a container and a compose file.
And because Tracker and the interface it publishes are open and MIT-licensed, the same kind of control plane is something you can build on Tracker yourself. Ours is where our pipelines run now, and the laptops can stay shut.